
Monitor Siebel Log Files
This tutorial covers the steps necessary for monitoring log files in
Siebel.
A couple things to note about this:
- VA2 monitors log files in real time
- VA2 monitors a whole directory, and every file in it, and every line within the files. So when you create a search string, that sting will be applied against every line. So when you create a search string, make sure it monitors for strings that are relevant, and hopefully with string that happen once per event.
- VA2 log file monitoring is not limited to Siebel, it can be set up for any directory.
Step 1 – Create an Error Definition
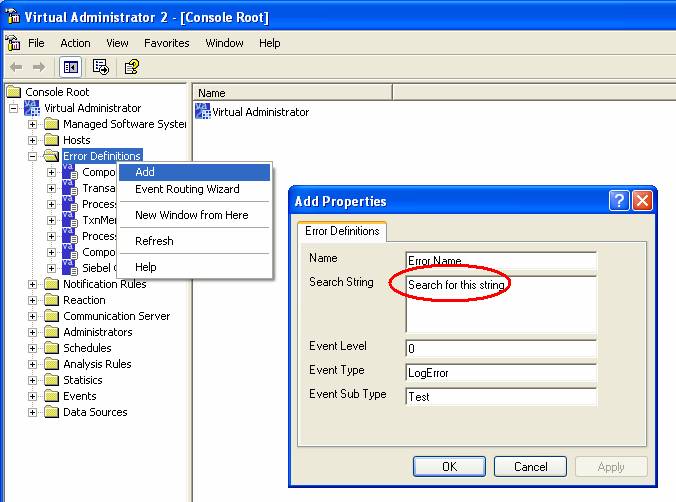
- Open the VA2 MMC and go to the Error Definitions section.
- We will enter a search string “Search for this string”
- The other properties of the Error Definition will cause determine the type of event to be generated, so create a Name, Event Type, and Sub Type of any sort you want.
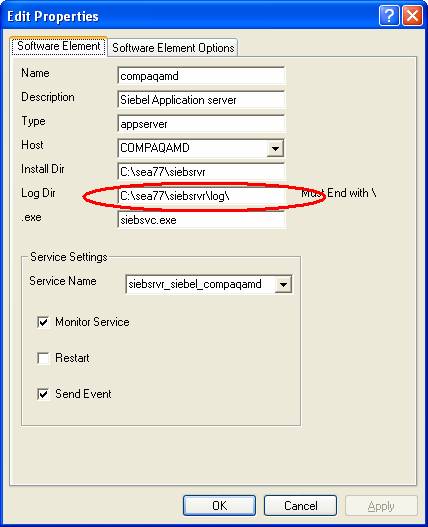
Step 2 – Examine the Log file that will be monitored
We will add Error Definition to a Software Element > Application Log File Definitions. By examining the Software Element, we can see which log file is monitored by the Software Element. Note, a new software element can be created to monitor log files, log file monitoring is not limited to Siebel directories.
*Make sure to change the drive letter to lower case, ie c:\sea77\... etc.
Now that you have seen which directory will be monitored, we will add the Error Definition, or Search String, to this directory.
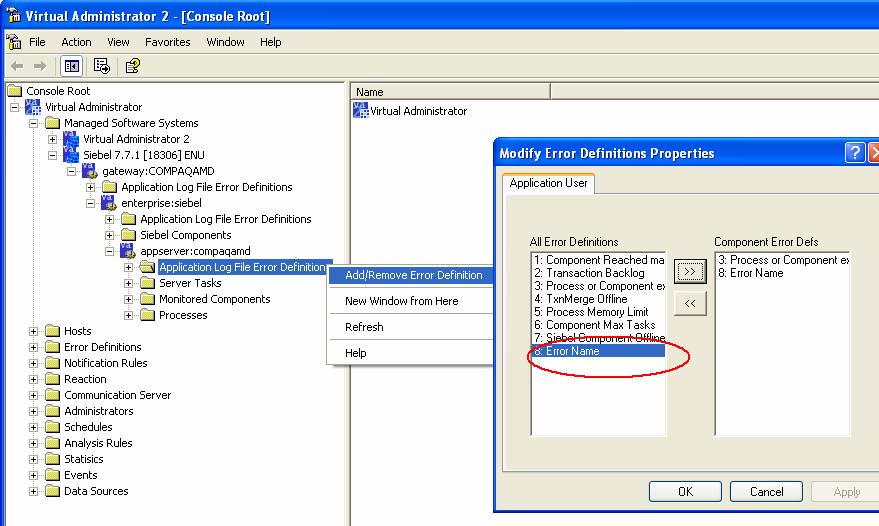
In this case, we have added a Error Definition from Step 1 “Error Name” which has search string of “Search for this string”. When you press OK, this string is now monitored in specified directory.
Step 3 – Testing
If you want to test this system, you can open a notepad write in “Search for this string”, and save it in the monitored directory. In this example, the log directory is C:\sea77\siebsrvr\log\. When the new file is added, an Event should be generated, according to the Error Definition created.
Things to note:
- When adding an error definition to a log directory, a message is sent to the VA2 LSM on the host being monitored, to look for the new search string
- If you add a new Software Element with a directory, you need to restart the LSM on the target machine to pick up new log file searches
- If you change the Search String parameter of an error definition, you should restart the LSM, or remove the Error Definition then Re Add it. Or Restart the LSM to pick up the change.
- Make sure to change the drive letter to lower case if there are issues generating events
- You can look in the vapplogmon.log on the LSM machine for errors or messages related to log file monitoring